ଫାଇଲ:Riemann sum convergence.png

ଏହି ଦେଖଣାର ଆକାର: ୬୦୦ × ୬୦୦ ପିକ୍ସେଲ । ବାକି ରେଜୋଲୁସନ: ୨୪୦ × ୨୪୦ ପିକ୍ସେଲ | ୪୮୦ × ୪୮୦ ପିକ୍ସେଲ | ୭୬୮ × ୭୬୮ ପିକ୍ସେଲ | ୧,୨୬୦ × ୧,୨୬୦ ପିକ୍ସେଲ.
ମୂଳ ଫାଇଲ (୧,୨୬୦ × ୧,୨୬୦ ପିକସେଲ, ଫାଇଲ ଆକାର: ୬୬ KB, ଏମ.ଆଇ.ଏମ.ଇର ପ୍ରକାର: image/png)
This is a file from the Wikimedia Commons. Information from its description page there is shown below. |
ସାରକଥା
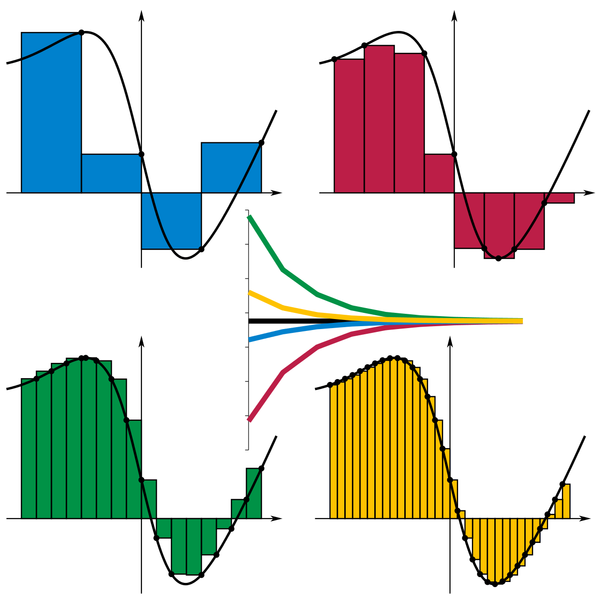
| ବିବରଣୀ | Show convergence of Riemann sum for all sample position choices as intervals shrink |
| ତାରିଖ | |
| ମୂଳାଧାର | self-made using text editor, rendered by GLIPS Graffiti |
| ଲେଖକ | KSmrq |

|
This graph image could be re-created using vector graphics as an SVG file. This has several advantages; see Commons:Media for cleanup for more information. If an SVG form of this image is available, please upload it and afterwards replace this template with
{{vector version available|new image name}}.
It is recommended to name the SVG file “Riemann sum convergence.svg”—then the template Vector version available (or Vva) does not need the new image name parameter. |
Comment
An example of Riemann sums for the integral sampling each interval at right (blue), minimum (red), maximum (green), or left (yellow). Convergence of all four choices to 3.76 occurs as number of intervals increases from 2 to 10 (and implicitly, to ∞).

ସତ୍ଵ
I, KSmrq, ଏହି କାମର ସତ୍ଵାଧିକାରୀ, ଏଠାରେ ତଳଲିଖିତ ଲାଇସେନ୍ସ ଅଧୀନରେ ଏହାକୁ ପ୍ରକାଶ କଲେ:

|
ମାଗଣା ସଫ୍ଟବେର ଫାଉଣ୍ଡେସନ ଦେଇ ପ୍ରକାଶିତ କୌଣସି ବଦଳାଇ ନହେବା ଭଳି ଧାରା, ଆଗ ବା ପଛ ପଟ ମଲାଟ ବିନା GNU ଖୋଲା ଦଲିଲକାରଣ ଲାଇସେନ୍ସ ୧.୨ ତମ ସଙ୍କଳନ ବା ଆଉ କୌଣସି ସର୍ତ୍ତାବଳି ଅନୁସାରେ ଏହି ଦଲିଲର ନକଲ, ବଣ୍ଟନ ତଥା/କିମ୍ବା ବଦଳାଇବା ନିମନ୍ତେ ଅନୁମତି ଦିଆଗଲା । GNU ମାଗଣା ଦଲିଲକରଣ ଲାଇସେନ୍ସ ନାମକ ବିଭାଗରେ ଲାଇସେନ୍ସର ନକଲ ଦିଆଯାଇଅଛି । |
| ଏହି ଫାଇଲଟି କ୍ରିଏଟିଭ କମନ୍ସ ଅଧୀନରେ ଆଟ୍ରିବୁସନ ସେଆର-ଏଲାଇକ ୩.୦ ଅନପୋର୍ଟେଡ଼ ଲାଇସେନ୍ସରେ ପଞ୍ଜିକରଣ କରାଯାଇଅଛି । | ||
| ଶ୍ରେୟ: I, KSmrq | ||
| ||
| GFDL ଲାଇସେନ୍ସ ଅପଡେଟର ଏକ ଭାଗ ଭାବରେ ଏହି ଲାଇସେନ୍ସ ଚିହ୍ନଟି ଏହି ଫାଇଲରେ ଯୋଡ଼ା ଯାଇଥିଲା । |
ଏହି ଫାଇଲଟି କ୍ରିଏଟିଭ କମନ୍ସ ଅଧୀନରେ ଆଟ୍ରିବୁସନ ସେଆର-ଏଲାଇକ ୨.୫ ଜେନେରିକ ଲାଇସେନ୍ସରେ ପଞ୍ଜିକରଣ କରାଯାଇଅଛି ।
ଶ୍ରେୟ: I, KSmrq
- ଆପଣ ଆରାମରେ:
- ବାଣ୍ଟିପାରିବେ – କାମଟିକୁ ନକଲ କରିପାରିବେ, ବାଣ୍ଟିପାରିବେ ଓ ପ୍ରସାରଣ କରିପାରିବେ
- ମିଶାଇପାରିବେ – କାମଟି ଅଭିଯୋଜନ କରିପାରିବେ
- ତଳଲିଖିତ ସର୍ତ୍ତାବଳୀ ଅଧୀନରେ:
- ଶ୍ରେୟ – ଆପଣ ମନେ କରି ଏହି କାମର ଆବଶ୍ୟକୀୟ ଶ୍ରେୟ ମୂଳ ଗଢ଼ାଳି ବା ସ୍ୱତ୍ୱାଧୀକାରୀଙ୍କୁ ଦେବେ ଏବଂ ଦେଲାବେଳେ ଲାଇସେନ୍ସର ଲିଙ୍କ ଦେଇ କି କି ବଦଳ କଲେ ଉଲ୍ଲେଖ କରିବେ । ଏହା ଉପଯୁକ୍ତ ଢଙ୍ଗରେ କରିବେ କିନ୍ତୁ ଲାଇସେନ୍ସ ଦେଉଥିବା ବ୍ୟକ୍ତି ଆପଣଙ୍କ ପ୍ରଚାର କଲା ଭଳି କିଛି ଲେଖିବେ ନାହିଁ ।
- ସେଆର ଏଲାଇକ – ଯଦି ଆପଣ ଏହି କାମଟିକୁ ବଦଳାଇବେ, ରୂପାନ୍ତରଣ କରିବେ ବା ଏହାକୁ ନେଇ କିଛି ଗଢ଼ିବେ ତେବେ ଆପଣ ଏହାକୁ ଏକା ବା ଅଲଗା ଲାଇସେନ୍ସ ଭିତରେ ରଖିପାରିବେ ।
ଆପଣ ନିଜ ପସନ୍ଦର ଲାଇସେନ୍ସ ବାଛିପାରିବେ ।
ଫାଇଲ ଇତିହାସ
ଏହା ଫାଇଲଟି ସେତେବେଳେ ଯେମିତି ଦିଶୁଥିଲା ତାହା ଦେଖିବା ପାଇଁ ତାରିଖ/ବେଳା ଉପରେ କ୍ଲିକ କରନ୍ତୁ
| ତାରିଖ/ବେଳ | ନଖ ଦେଖଣା | ଆକାର | ବ୍ୟବହାରକାରୀ | ମତାମତ | |
|---|---|---|---|---|---|
| ଏବେକାର | ୧୬:୩୬, ୪ ଜୁଲାଇ ୨୦୦୭ | | ୧,୨୬୦ × ୧,୨୬୦ (୬୬ KB) | KSmrq~commonswiki | {{Information |Description=Show convergence of Riemann sum for all sample position choices as intervals shrink |Source=self-made using text editor, rendered by GLIPS Graffiti |Date=2007-07-04 |Author= KSmrq }} == Comment == An example of R |
ଫାଇଲ ବ୍ୟବହାର
ଏହି ଫାଇଲ ସହିତ ଯୋଡ଼ା ଗୋଟିଏ ବି ପୃଷ୍ଠା ନାହିଁ ।
ଜଗତ ଫାଇଲ ବ୍ୟବହାର
ତଳଲିଖିତ ଉଇକିସବୁ ଏହି ଫାଇଲଟିକୁ ବ୍ୟବହାର କରିଥାନ୍ତି:
- ar.wikipedia.orgରେ ବ୍ୟବହାର
- ar.wikiversity.orgରେ ବ୍ୟବହାର
- ast.wikipedia.orgରେ ବ୍ୟବହାର
- be.wikipedia.orgରେ ବ୍ୟବହାର
- ca.wikipedia.orgରେ ବ୍ୟବହାର
- ckb.wikipedia.orgରେ ବ୍ୟବହାର
- cs.wikipedia.orgରେ ବ୍ୟବହାର
- el.wikipedia.orgରେ ବ୍ୟବହାର
- en.wikipedia.orgରେ ବ୍ୟବହାର
- en.wikiversity.orgରେ ବ୍ୟବହାର
- es.wikipedia.orgରେ ବ୍ୟବହାର
- et.wikipedia.orgରେ ବ୍ୟବହାର
- fa.wikipedia.orgରେ ବ୍ୟବହାର
- hak.wikipedia.orgରେ ବ୍ୟବହାର
- he.wikipedia.orgରେ ବ୍ୟବହାର
- hr.wikipedia.orgରେ ବ୍ୟବହାର
- hu.wikipedia.orgରେ ବ୍ୟବହାର
- id.wikipedia.orgରେ ବ୍ୟବହାର
- ja.wikipedia.orgରେ ବ୍ୟବହାର
- km.wikipedia.orgରେ ବ୍ୟବହାର
- kn.wikipedia.orgରେ ବ୍ୟବହାର
- ko.wikipedia.orgରେ ବ୍ୟବହାର
- ku.wikipedia.orgରେ ବ୍ୟବହାର
- lt.wikipedia.orgରେ ବ୍ୟବହାର
- pl.wikipedia.orgରେ ବ୍ୟବହାର
- pnb.wikipedia.orgରେ ବ୍ୟବହାର
- pt.wikipedia.orgରେ ବ୍ୟବହାର
- ro.wikipedia.orgରେ ବ୍ୟବହାର
- ru.wikipedia.orgରେ ବ୍ୟବହାର
- simple.wikipedia.orgରେ ବ୍ୟବହାର
- sq.wikipedia.orgରେ ବ୍ୟବହାର
- sr.wikipedia.orgରେ ବ୍ୟବହାର
- sv.wikipedia.orgରେ ବ୍ୟବହାର
- sw.wikipedia.orgରେ ବ୍ୟବହାର
- tl.wikipedia.orgରେ ବ୍ୟବହାର
- tr.wikipedia.orgରେ ବ୍ୟବହାର
- uk.wikipedia.orgରେ ବ୍ୟବହାର
ଏହି ଫାଇଲଟିର ଅଧିକ ବିଶ୍ୱବ୍ୟାପୀ ବ୍ୟବହାର ଦେଖନ୍ତୁ ।